SugarDashboard
Dashboard TUI library — grid layouts, panels, and more

Build dashboard-style terminal UIs with column grid layouts, framed panels, status bars, tabs, and more. Compose complex layouts from reusable components.
Install
composer require sugarcraft/sugar-dashboardQuickstart
use SugarCraft\Dashboard\Layout\Grid\{StackedGrid, Options, ItemOptions};
use SugarCraft\Dashboard\Components\Card\{Card, Text};

$grid = new StackedGrid(new Options(fitScreen: true));
$grid->addItem(Card::titled(Text::new('CPU 42%'), 'Load'), new ItemOptions(column: 0));
$grid->addItem(Card::titled(Text::new('3 alerts'), 'Alerts'), new ItemOptions(column: 1, expandVertical: true));

$grid->setSize(100, 24);
echo $grid->render();   // two bordered cards side by side; below 90 columns they stack
What's in the box
StackedGridColumn grid layout with weighted sizing and gap support.
FrameFramed panel with border, title, and padding.
StatusBarStatus bar component for dashboard footers.
TabsTabbed interface for switching between views.
Card / Box / ParagraphReusable UI components for building panels.
Event systemKeyboard, mouse, focus, and resize event handling.
DualSampleGraphbtop's history graph: two samples per cell quantized through the 5×5
graph_symbols table, in braille / block / block2 / tty families, with invert, no-zero, max-value scaling, gradient colouring and the graph_bg underlay.Position-coloured Meter
Meter::withGradient($stops, positionWise: true) renders btop's one-row ■ bar — each cell coloured at its own position on a 101-stop ramp, meter_bg tail, invert, memoized per shape.Gradients
Gradient101::expand() (btop's integer ramp law), GradientStore named ramps (at('cpu', 73)), and value-driven BrailleCanvas::withGradient().NetAutoScalebtop's network-graph ceiling hysteresis: grows or shrinks only after 5 sustained samples, 10 KiB floor, optional shared (sync) ceiling.
Process rows
ProcRowComposer renders a btop process-list row (pid … mem, 5×1 cpu mini-graph on graph_bg, cpu%) with DistanceFade shading; ProcGraphTracker manages per-pid graphs.btop-style graphs & meters
Ported from aristocratos/btop for candy-top; colour and quantization laws are byte-faithful to btop. Run php examples/dual-sample-graph.php for every family.
use SugarCraft\Core\Util\Color;
use SugarCraft\Dashboard\Plot\Braille\DualSampleGraph;
use SugarCraft\Dashboard\Plot\Chart\Meter;

$stops = [Color::hex('#80d0a3'), Color::hex('#dcd179'), Color::hex('#d45454')];

echo DualSampleGraph::new(12, 3)
    ->withGradient($stops)
    ->withData(5, 12, 30, 55, 80, 95, 70, 45, 20, 10, 35, 60)
    ->render(), "\n";

echo Meter::new(0.62)->withWidth(20)->withGradient($stops, positionWise: true)->render(), "\n";
Showcase examples
Server Showcase
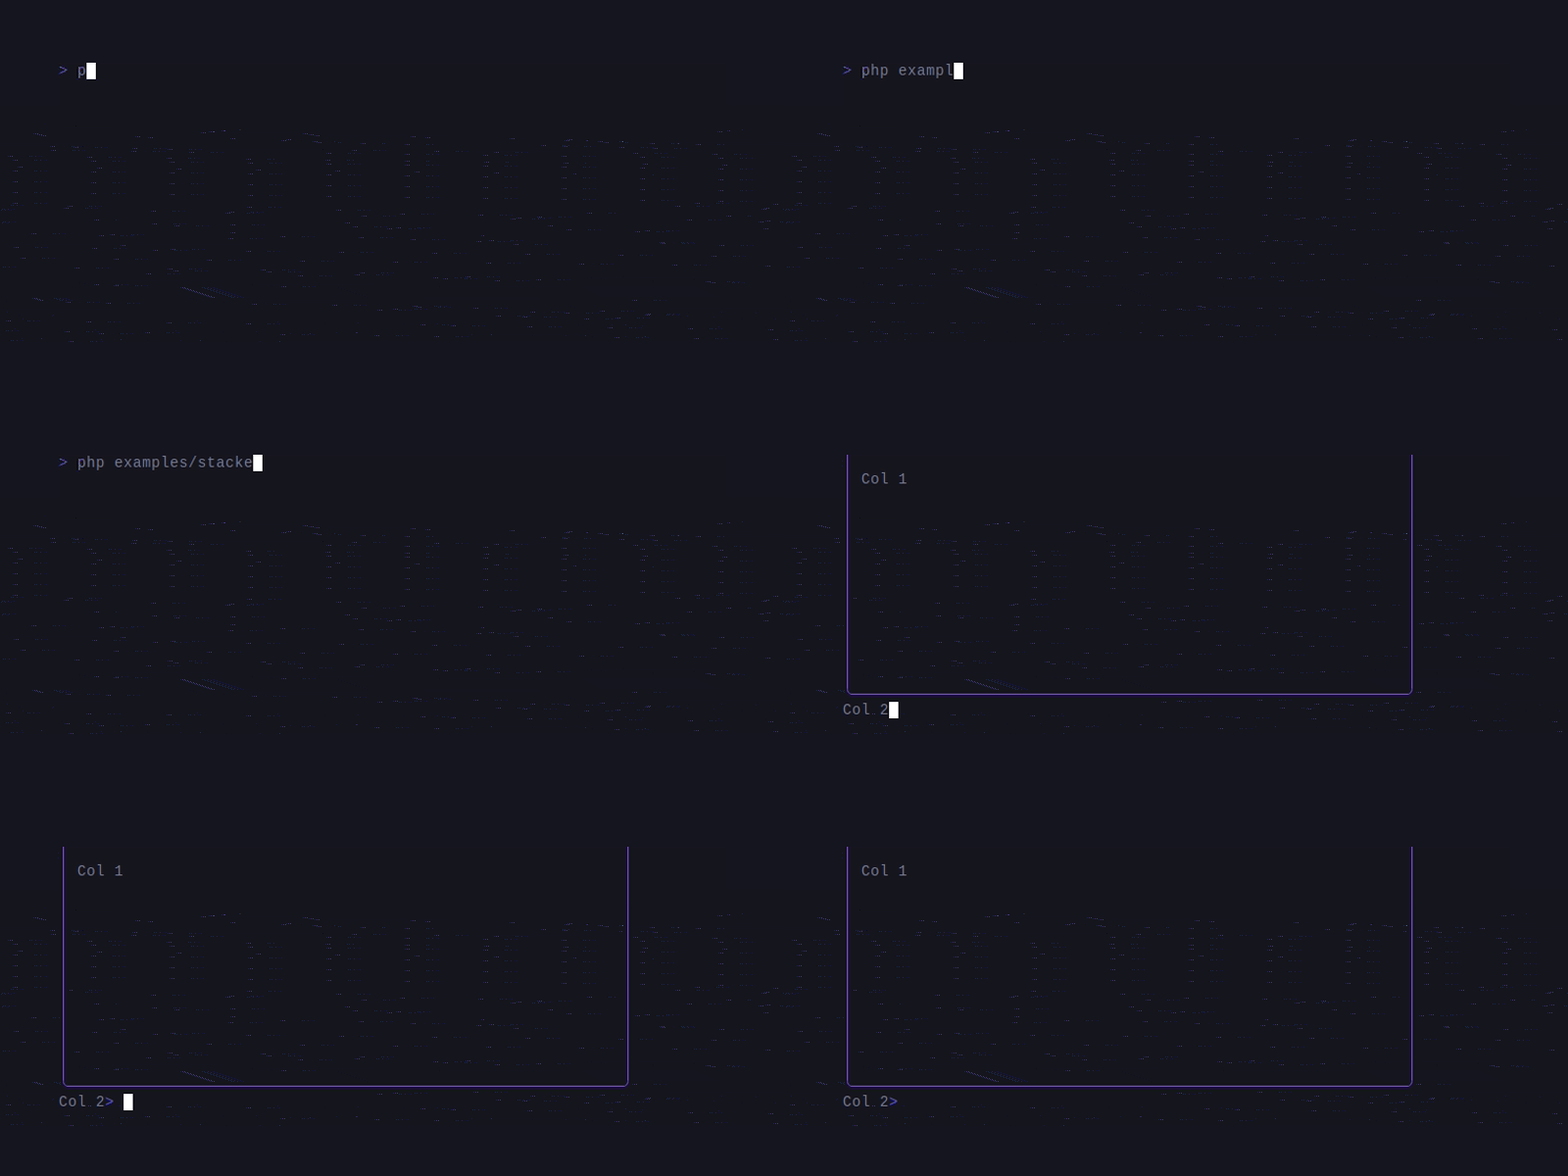
Production dashboard — gauges, charts, avatars, timeline in multi-column layout.
View gif →
View gif →
Source & demos
- Source on GitHub
- Full README
- Runnable examples
- Originally inspired by charmbracelet/bubble-grid (Go); SugarCraft is developed as a native PHP project.
API
| Class | Method | Description |
|---|---|---|
| Layout\Grid\StackedGrid | __construct(Options = new Options()) | Column grid; columns stack vertically below the narrow breakpoint (90 cells) |
| Layout\Grid\StackedGrid | addItem(Item, ItemOptions = new ItemOptions()) | Add an item to a column |
| Layout\Grid\StackedGrid | setSize(width, height) / render() / withTheme(Theme) | Size, render to an ANSI string, theme |
| Layout\Grid\Options / ItemOptions | new Options(fitScreen: bool) / new ItemOptions(column: int, expandVertical: bool) | Grid and per-item options |
| Components\Card\Card | static titled(Item, string $title) | Bordered card with a title |
| Layout\Frame | static new(Item) / withTitle() / withBorder() / withPadding() | Framed panel |
| Plot\Gradient101 | static expand(list<Color> $stops) | btop's 101-entry ramp (index = percent), truncating integer law |
| Plot\Braille\BrailleCanvas | withGradient(stops, ?scale) / withValue(v) / withoutGradient() / gradient() / value() | Null-colour dots take the ramp colour at the current value |
| Plot\Braille\DualSampleGraph | static new(width, height, family, invert, noZero, maxValue, offset) | btop Draw::Graph; families FAMILY_BRAILLE / FAMILY_BLOCK / FAMILY_TTY |
| Plot\Braille\DualSampleGraph | push(...$v) / withData(...$v) / withGradient(stops) / withUnderlay(Color) / render(?profile) | Append or replace history, colour, underlay, render |
| Plot\Braille\DualSampleGraph | static underlay(family, cells, Color) | Bare btop graph_bg strip (⣀ ▄ ░) |
| Plot\Chart\Meter | withGradient(stops, positionWise) / withGlyph() / withInvert() / withMeterBg() | btop Draw::Meter position-coloured bar; memoStats() / resetMemo() |
| Foundation\NetAutoScale | static new(sync) / offer(down, up) / downloadMax() / uploadMax() / forceRescale() | btop net-graph ceiling hysteresis |
| Foundation\GradientStore | static fromStops(array) / withGradient(name, start, ?mid, ?end) / at(name, percent) | Named 101-entry ramps (btop Theme::g) |
| Plot\DistanceFade | ramp() / distance() / fadeColor() / metricColor() / flatMetricColor() / metricValues() | btop proc-list distance fade |
| Plot\ProcRow\ProcRowComposer | static new(width) / row(ProcRow, row, selected, selectMax, ?graph, followed) | One btop process-list row; ProcRow, ProcColumns, ProcRowPalette, ProcGraphTracker supply data, layout, colours and mini-graphs |